When you host a big meeting or event, analyzing how your attendees felt about the event, with survey questions, can be helpful in many ways, though it can take a good deal of effort and time to collect data. But if you don’t know how to analyze survey data in a meaningful way, it can be difficult to understand your attendees’ feedback and identify trends in their responses. You might miss out on valuable insights.
Every organization needs a method for squeezing every bit of insight and action out of raw data. In this article, we’ll show you how to analyze survey data to draw meaningful conclusions that will help you grade your recent event and get a head start on planning better future events.
How do you analyze post-event survey data?
Survey results on their own don’t amount to much if you aren’t educated on data analysis. If you’ve never completed a survey analysis before, this section will break down how to analyze survey results to draw conclusions about your event. Even if you ultimately decide, like so many others, to hire experts to do this work, it’s still good to know the basics of what you are paying for.
There’s one big tip you should know when you are drawing up a survey. It’s important to have an end result in mind and position yourself to get actionable insights from analyzing data from your survey respondents.
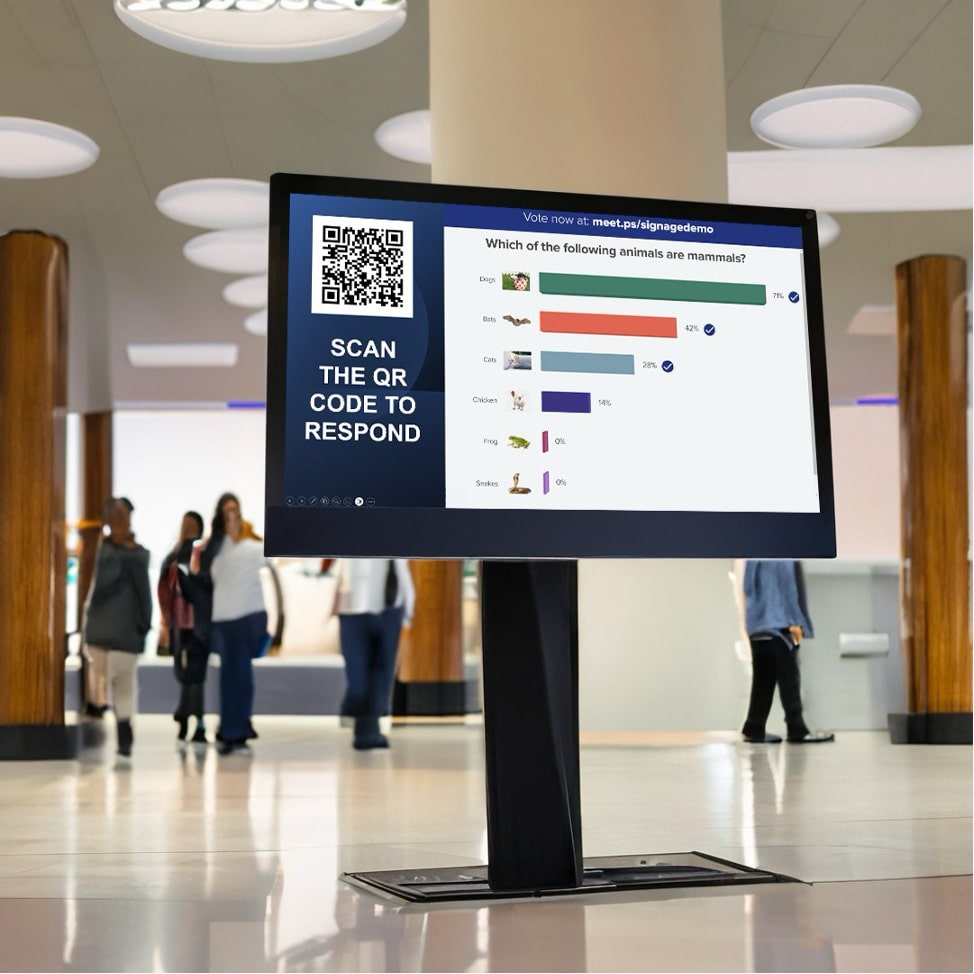
Once you know what kind of feedback you’re seeking, consider the different types of surveys that can be done. MeetingPulse has many tools — including live polling and surveys, Q&As, and Pulse™ emojified sentiment analysis — to help you derive both qualitative data and quantitative data from your target audience.
Qualitative and quantitative data
Qualitative data refers to data points that can be observed but not easily measured, such as emotion and long-form comments, while quantitative data is anything that can be given numerical values. Generally, it’s a good idea to first analyze quantitative data because it can help you parse the qualitative data.
Here’s an example of how: Let’s say that 60% of your respondents answered that they’re unhappy with a particular service or product. That number is quantitative data. It tells you there’s a serious problem to address, and you can focus first on the negative reviews about user experience. The qualitative part of analyzing survey data would consist of your looking at all or some of the specific comments in those reviews or using a tool to distill them. Doing that can help you identify roadblocks in the customer journey and correct any pain points creating a negative experience.
Using a good mix of open-ended questions and closed-ended questions can help you drill down to the heart of attendee sentiment. Open-ended questions are ideal if you’re looking to get descriptive answers for qualitative research, because such research questions will prompt respondents to think about their answers in detail. In turn, the collected data will be more specific. That being said, mixing in closed-ended questions can return straightforward data that’s easier to standardize and compare.
Net promoter score questions (used in an NPS survey to determine a rating) ask people to give a score from 0 to 10 on whether they would recommend a company to a friend or colleague. This is one way of turning a complex thought into numerical data. A net promoter score is a great way to get an idea of how your organization is doing in general.
How to analyze survey data well
The best way forward will depend largely on how much data you collected, and understanding the data you’re working with.
There are countless survey-data analysis tools and services available online, all easily accessible with a quick internet search. Many will use artificial intelligence and machine learning to sort through your data quickly and create a survey report or visual representation that helps you understand the statistical significance of your research findings. These software tools can be cloud-based or browser-based and can integrate with specific survey platforms when you begin analyzing survey results.
MeetingPulse survey analysis tools include an array of report-related functions and features, including:
- Summary reports.
- PDF/Print view.
- CSV Export.
- Custom Report Design.
- Preservation of anonymity.
- Participant activity summaries.
- Auditable voting records
In the broader sense, there are many methods for analyzing data. Here are a few examples of how you can break down your data.
Cross-tabulation
This is the process of breaking your data out into sub-groups and comparing data variables to each other to see how multiple variables relate. It works best for categorical data, demographic data, or other types of structured data. For this method, it’s best to target your survey questions to address your research question.
Analyze scale data using mode, mean, and bar charts
If you’re looking to analyze the average of your data points, these are the three types of averages you can find. To determine the mean, you add the data and divide by the number of figures you added. To find the median, you arrange your data points from smallest to largest and find the middle. The mode is the data point that was your most frequent response.
Use filters
Creating filter rules for questions and answers can help you get actionable data from your survey results. Filters will help you find any answers that fit a specific criterion and hide responses that aren’t relevant. Combining filters can be a powerful way to find specific responses.
Break down comments into their constituent parts
For more detailed responses, you can separate the ideas within them into smaller comments or parts. This is also known as decomposition, and can help you analyze and parse more complex ideas.
Compare new data to previous data
Comparing data is a great way to track ratings, improvement, things like employee engagement or customer surveys that use net promoter scores. It allows for easy statistical analysis over any given period of time.
Look for patterns and trends
A trend comparison is an easy way to identify statistically significant data among your previous and current survey responses. Let’s say you have asked a particular question at the end of a certain event for the past seven years. Can you find a trend or pattern in the answers? Are there patterns within certain audience segments? Tracking this kind of data from year to year (or any time frame that applies to your survey) is called benchmarking, and can provide valuable insights.
Consider statistical significance
In survey analysis, “significant” takes on a different meaning than it does in everyday conversation. When analyzing data, significant means “an assessment of accuracy.” Response rates are important to consider. Let’s say you held a meeting with 150 attendees, and you asked all of them to complete an on-site survey at the end. How many respondents actually completed the survey? That number has a big impact on the accuracy of your survey’s results. So, if only 15 attendees answered your survey, your results could be flawed.
Consider causation and correlation
Causation is when a change in one thing causes a change in another thing. Correlation is when two variables move together but do not influence one another and were not moved by the same third factor. It’s a common mistake to assume that correlation shows causation.
Consider your gut
You’ve likely had a time where you come across something that feels off, and you know this because you have personal experience with the situation or content matter. That’s your gut talking, and if you have a gut reaction to your data, pay attention to it. Consider any personal experience you have.
Final data point
Effectively analyzing data is an important step in understanding how an audience feels about your brand. It can be hard to get right, but don’t let that stop you from digging into any data that can help your organization improve its processes, goods, or services. MeetingPulse offers several easy-to-use data analysis tools that can help take your organization to a higher level by collecting insights from its audiences.


